Figure 2.1 Labour Legislation Administered by the Labour Department (as at 31 December 2002)
click image enlarge
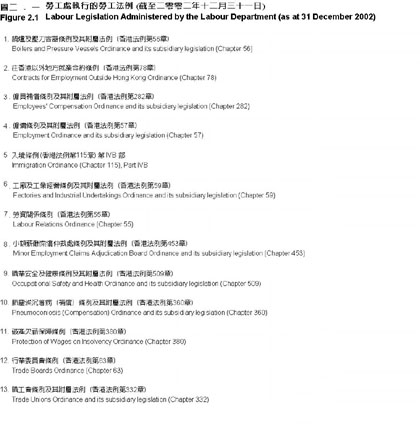
Figure 2.2Number of Summonses Convicted and Total Fines in 2002
click image enlarge
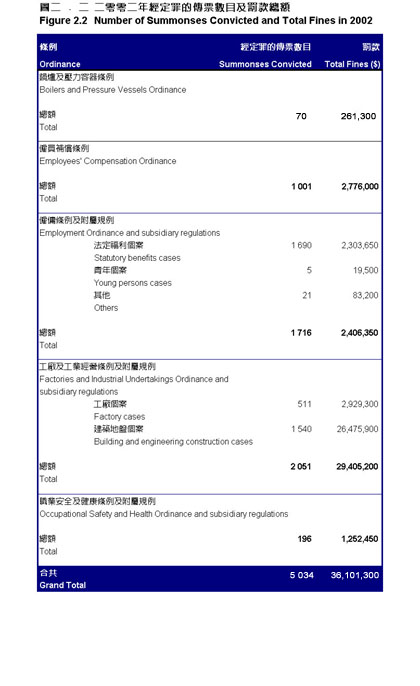
Figure 2.3Organisation Structure of the Labour Department (as at 31 December 2002)
click image enlarge
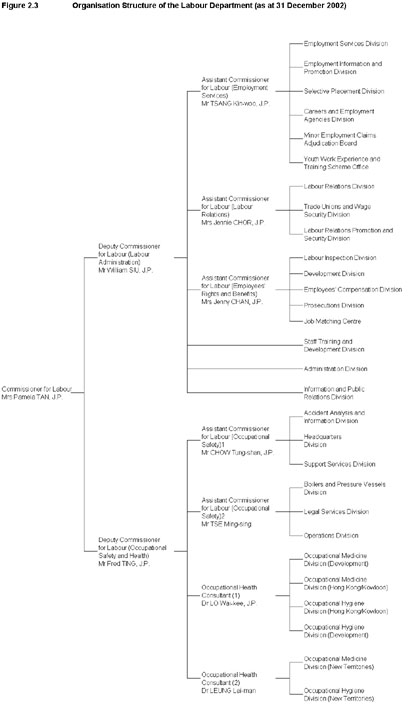
Figure 2.4Terms of Reference of the Labour Advisory Board and Membership for the Year 2002
click image enlarge
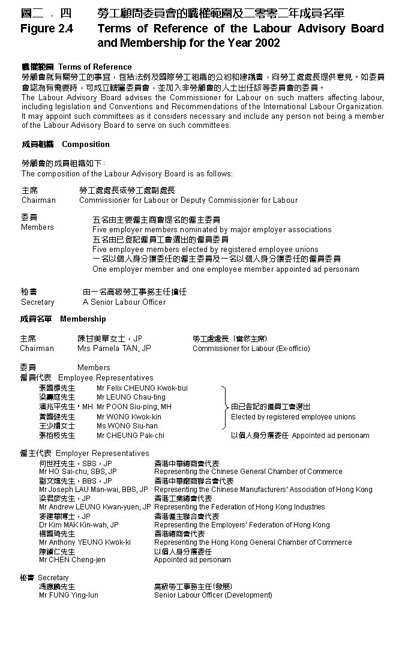
Figure 3.1Key Indicators of Work of the Labour Relations Programme Area in 2002
click image enlarge
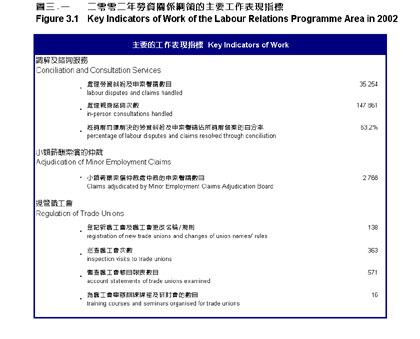
Figure 3.2Number of Labour Disputes Handled by the Labour Relations Division from 1998 to 2002
click image enlarge
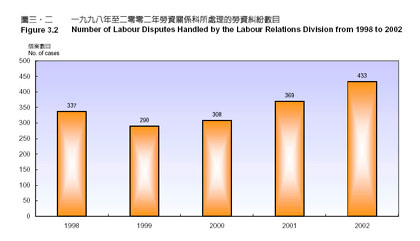
Figure 3.3Number of Claims Handled by the Labour Relations Division from 1998 to 2002
click image enlarge
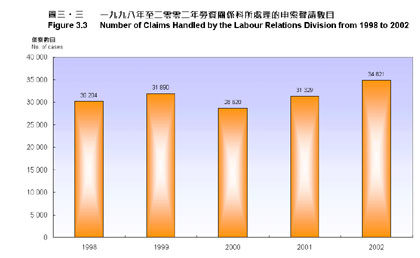
Figure 3.4Number of Labour Disputes Handled by the Labour Relations Division in 2002 by Cause
click image enlarge
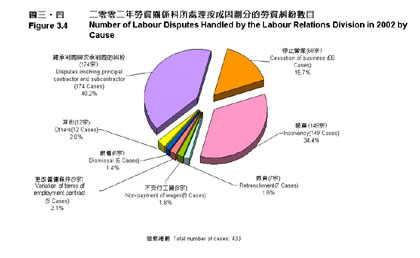
Figure 3.5Number of Claims Handled by the Labour Relations Division in 2002 by Cause
click image enlarge
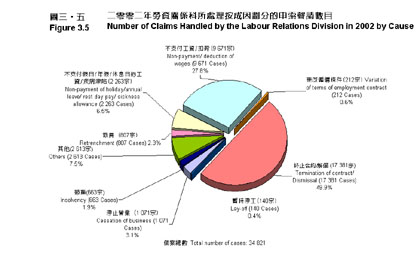
Figure 3.6Outcome of Cases Handled by the Labour Relations Division in 2002
click image enlarge
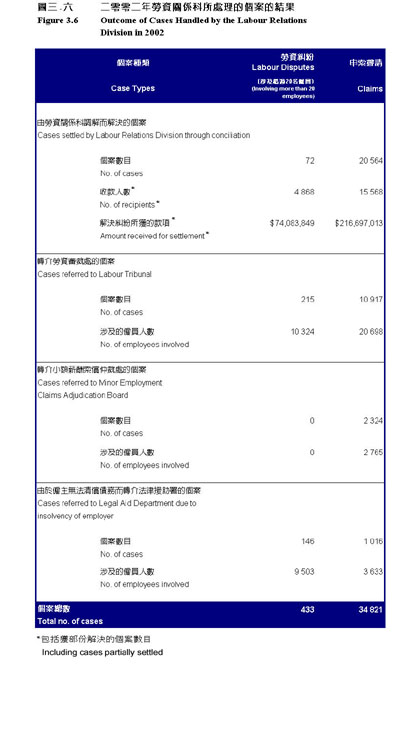
Figure 3.7Number of Strikes and Number of Employees Involved from 1998 to 2002
click image enlarge
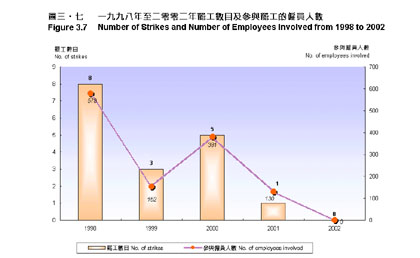
Figure 3.8Number
of Working Days Lost per 1 000 Salaried Employees and
Wage Earners from 1998 to 2002
click image enlarge
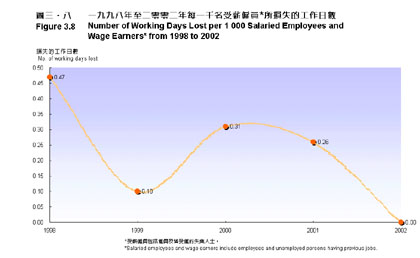
Figure 3.9Promotional Activities on Labour Relations Undertaken by the Labour Department in 2002
click image enlarge
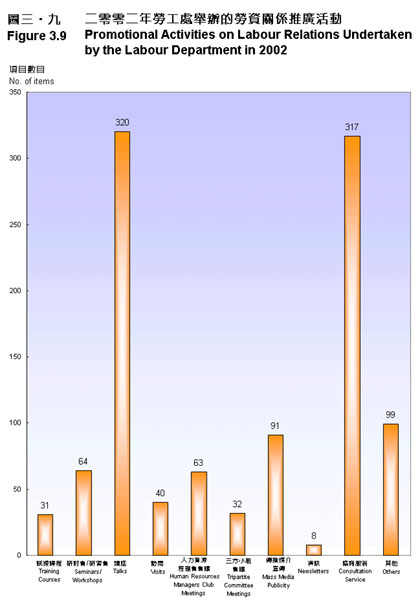
Figure 3.10Some New Reference Materials on Labour Relations Published in 2002
click image enlarge
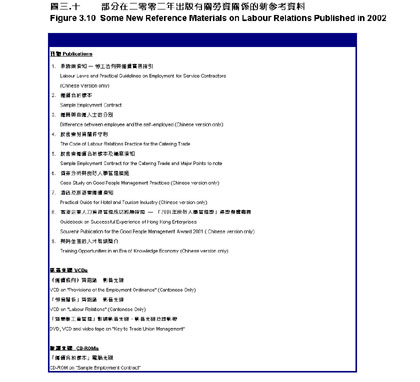
Figure 3.11Number of Claimed Items Registered with the Minor Employment Claims Adjudication Board in 2002 by Nature
click image enlarge
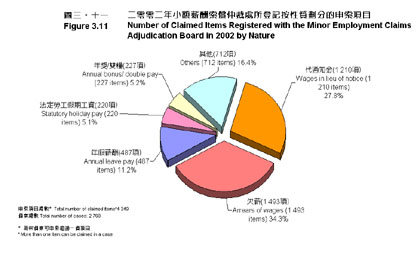
Figure 3.12Number of Registered Employee Unions and Declared Union Membership from 1998 to 2002
click image enlarge
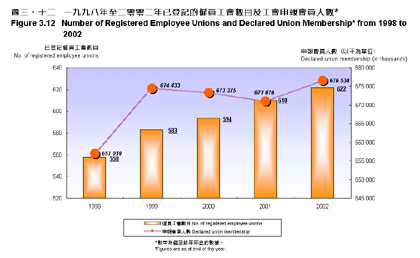
Figure 3.13Trade Union Participation Rates in Hong Kong from 1998 to 2002
click image enlarge
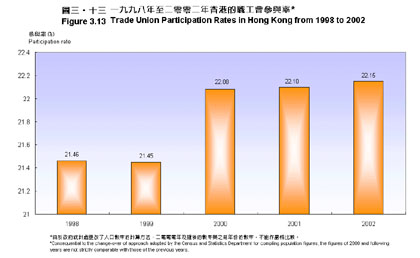
Figure 4.1Number of Occupational Injuries and Industrial Accidents from
1998 to 2002
click image enlarge
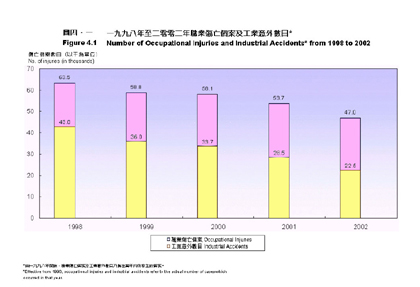
Figure 4.2Number of Occupational Injuries in Major Economic Sectors from
1998 to 2002
click image enlarge
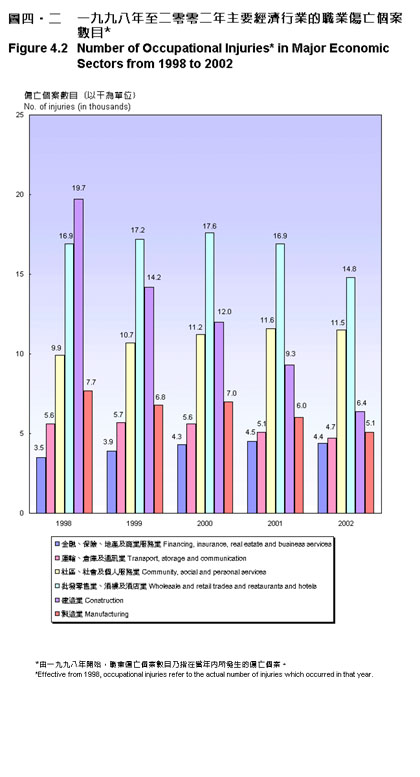
Figure 4.3Number
of Industrial Accidents in Selected Industries from
1998 to 2002
click image enlarge
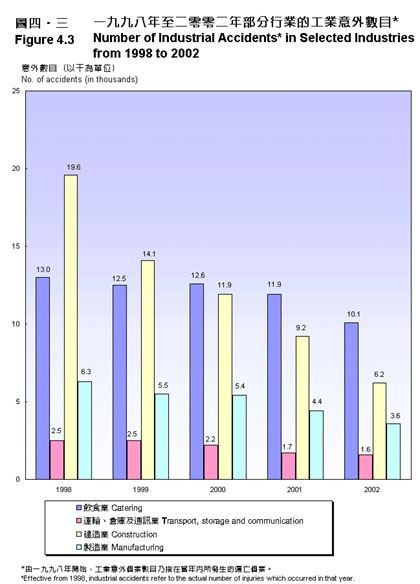
Figure 4.4Number of Industrial Accidents by Type of Accident from 2001 to 2002
click image enlarge
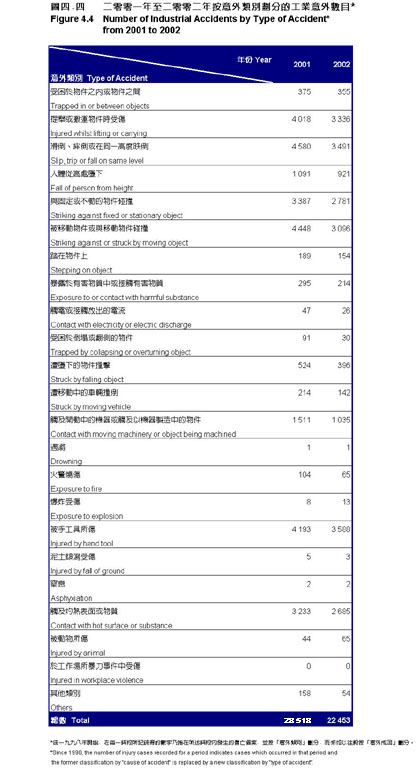
Figure 4.5Number of Industrial Accidents in 2002 by Type of Accident in Selected Industries
click image enlarge
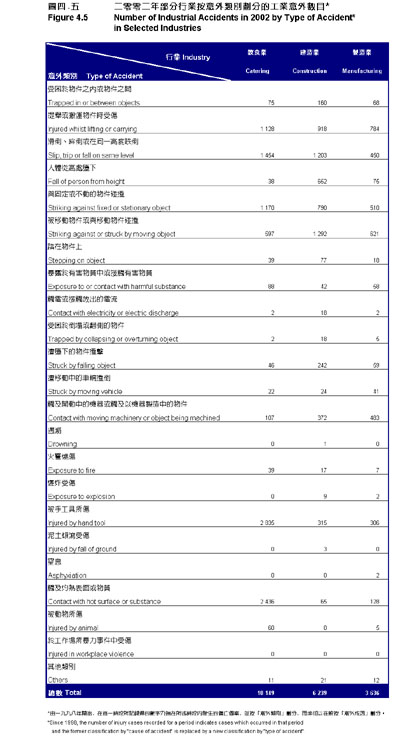
Figure 4.6Key Indicators of Work of the Programme of Safety and Health at Work in 2002
click image enlarge
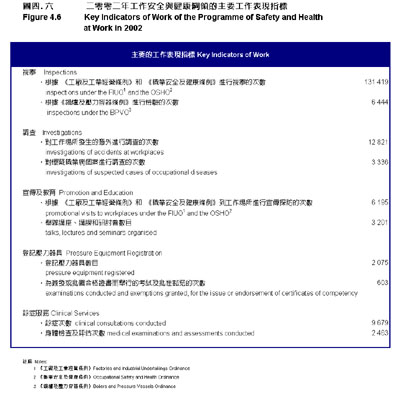
Figure 4.7Number of Inspections Made by Occupational Safety Officers
from 1998 to 2002
click image enlarge
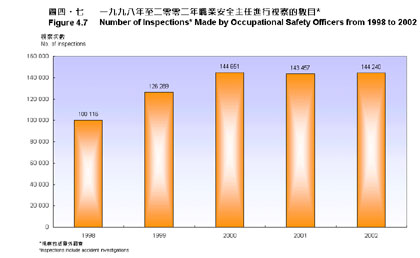
Figure 4.8Number of Visits and Inspections Made by Inspectors (Boilers and Pressure Vessels) from 1998 to 2002
click image enlarge
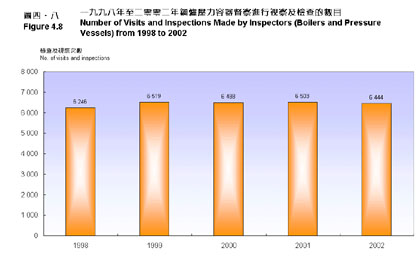
Figure 4.9Number of Confirmed Occupational Diseases in 2002
click image enlarge
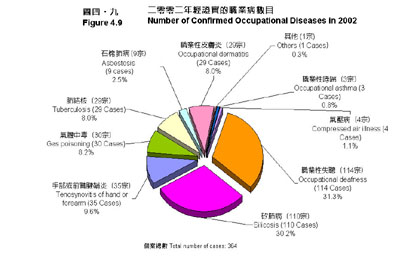
Figure 4.10Some New Publications on Safety and Health at Work
Published in 2002
click image enlarge

Figure 4.11Clinical and Advisory Services offered in 2002
click image enlarge
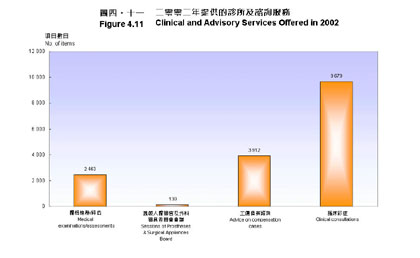
Figure 5.1Labour Force by Age and Sex in 2002
click image enlarge
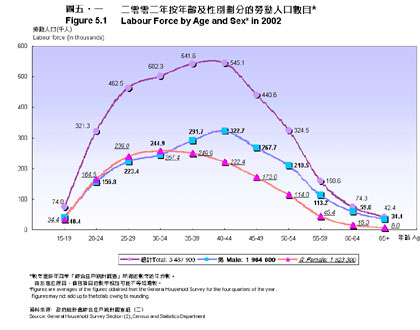
Figure 5.2Labour Force Participation Rate by Age and Sex in 2002
click image enlarge
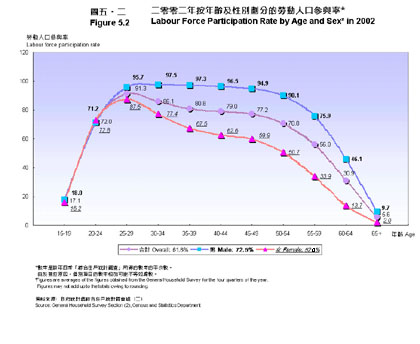
Figure 5.3Employed Persons in Major Economic Sectors by Sex from 1998 to 2002
click image enlarge
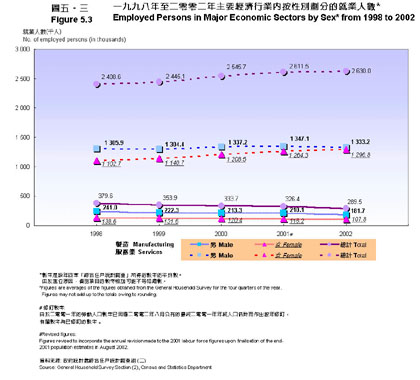
Figure 5.4 Distribution of Employed Persons by Occupation in 2002
click image enlarge
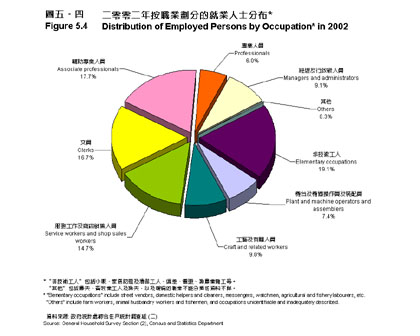
Figure 5.5Vacancies in Major Economic Sectors from 1998 to 2002
click image enlarge
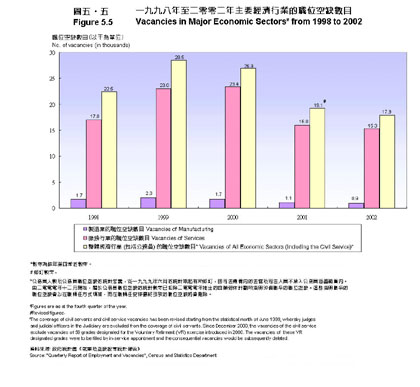
Figure 5.6Unemployed Persons by Age in 2002
click image enlarge
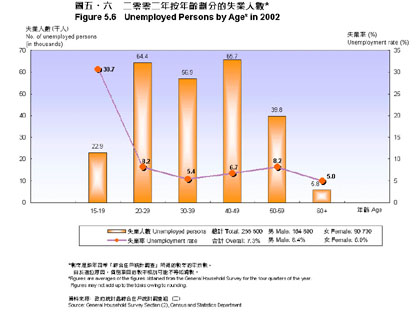
Figure 5.7Underemployed Persons by Age in 2002
click image enlarge
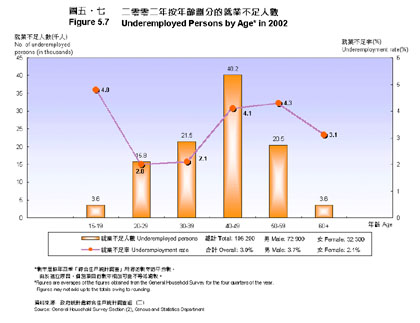
Figure 5.8Wage Indices and Percentage Change in Wage Indices in Selected Economic Sector between 2001 and 2002
click image enlarge
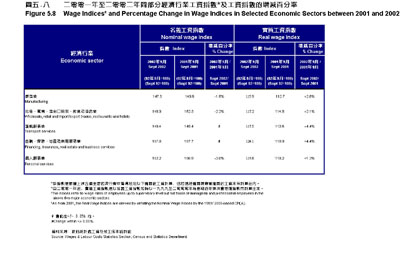
Figure 5.9Wage and Salaries of Employees in Selected Economic Sector in 2001 and 2002
click image enlarge
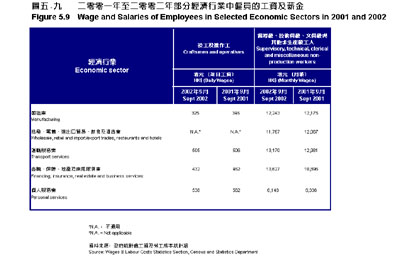
Figure 5.10Key Indicators of Work of the Employment Services Programme Area in 2002
click image enlarge
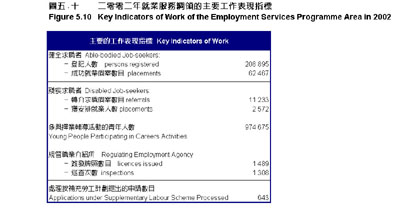
Figure 5.11Key Indicators of Work on Employment Assistance rendered to Able-bodied Job-seekers from 1998 to 2002
click image enlarge
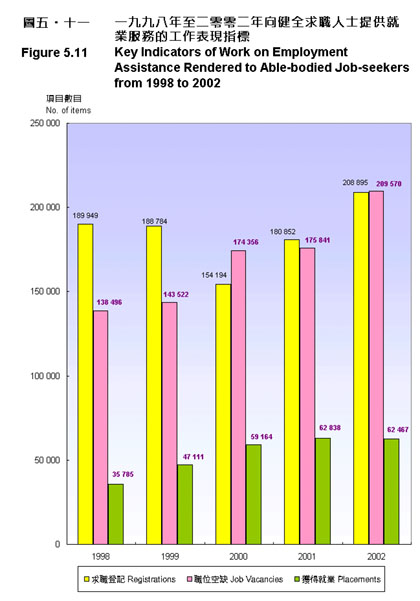
Figure 5.12Key
Indicators of Work on Employment Assistance rendered
to with
Job-seekers with a Disability from 1998 to 2002
click image enlarge
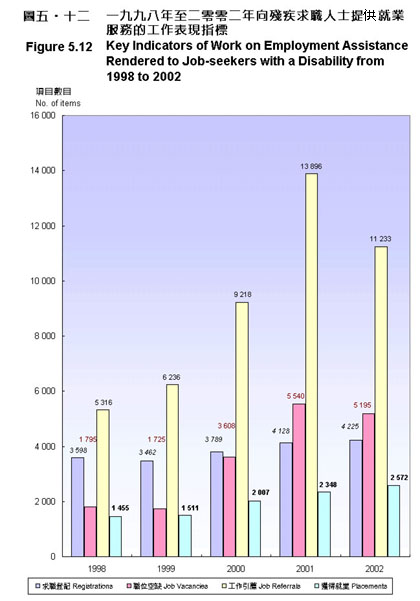
Figure 5.13Number of Young People Participating in Careers Activities from 1998 to 2002
click image enlarge
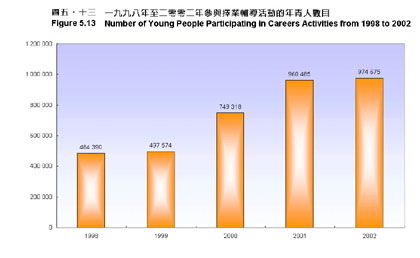
Figure 6.1Key
Indicators of Work of the Employee Rights and Benefits
Programme Area in 2002
click image enlarge
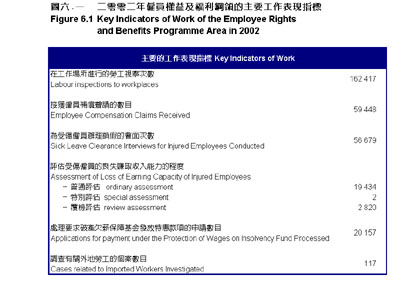
Figure 6.2Number of Labour Inspections Made in 2002 by Major Economic Sector
click image enlarge
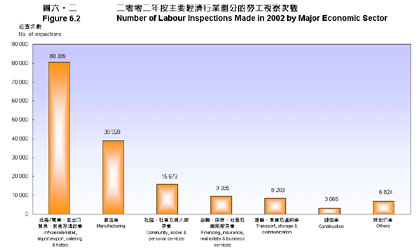
Figure 6.3Number of Cases Reported under the Employees' Compensation Ordinance in 2002 by Sex and Age
click image enlarge
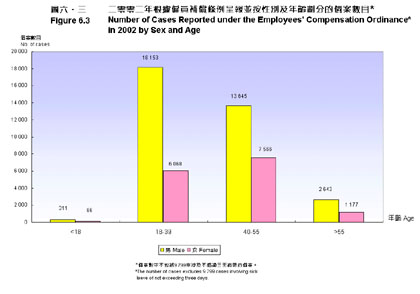
Figure 6.4Number of Cases Reported under the Employees' Compensation Ordinance from 1998 to 2002
click image enlarge
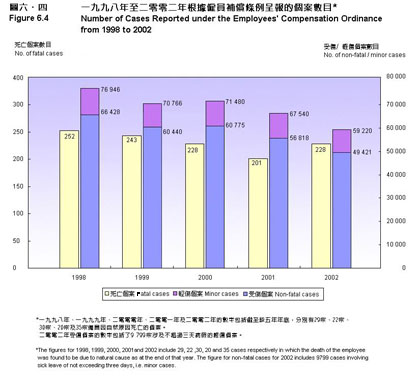
Figure 6.5Number of Employee Compensation Cases by Days Lost for Cases Reported in 2001 and Result Known as at 31 December 2002
click image enlarge
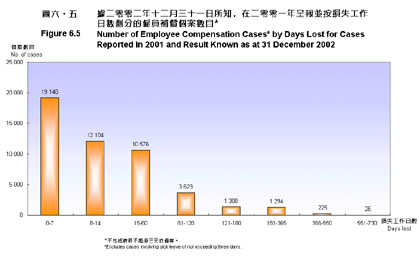
Figure 6.6Number of Applications Received by the Wage Security Unit from 1998 to 2002
click image enlarge
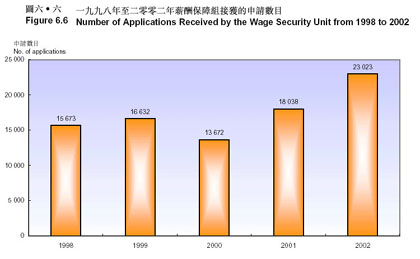
Figure 6.7Number of Applications Received by the Wage Security Unit in 2002 by Economic Sectors
click image enlarge
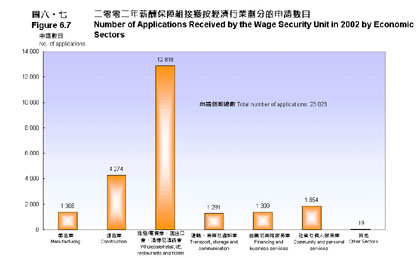
Figure 6.8Most Frequently Asked Topics Handled by the Telephone Enquiry Service in 2002
click image enlarge
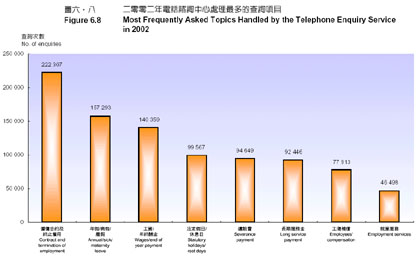
Figure 7.1List of the 41 International Labour Conventions Applied to the Hong Kong Special Administrative Region (as at 31 December 2002)
click image enlarge
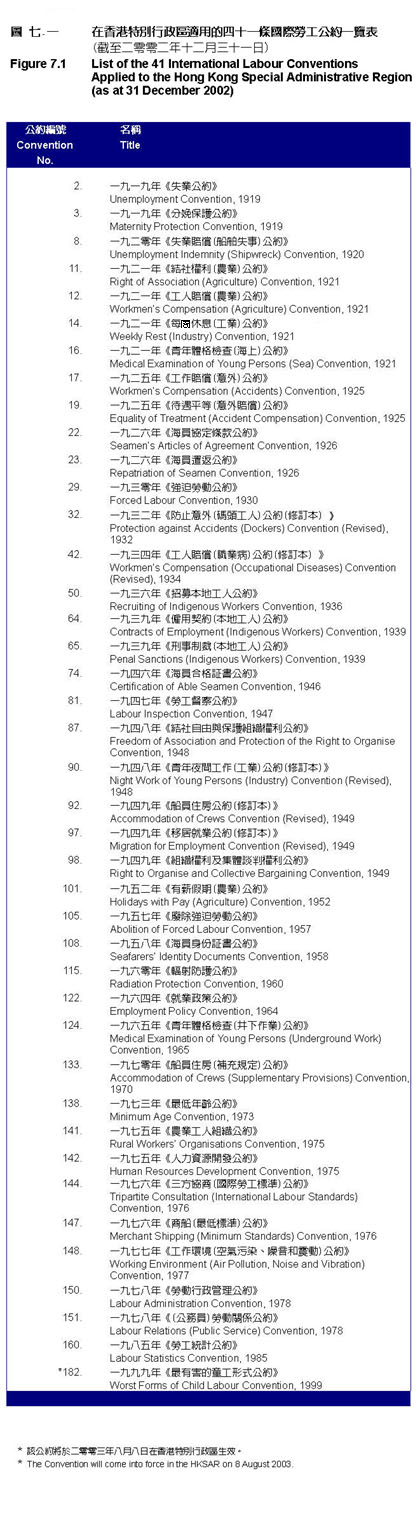
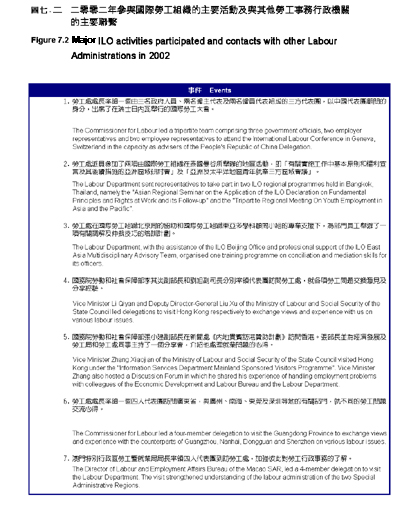
Figure 7.2Major
ILO Activities Participated and Contacts with Other
Labour Administrations in 2002
click image enlarge
|