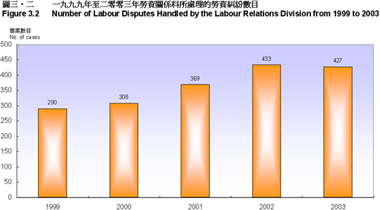
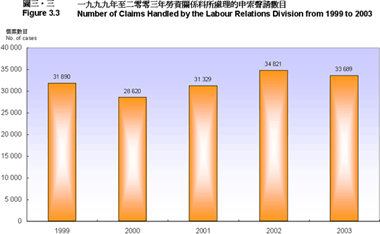
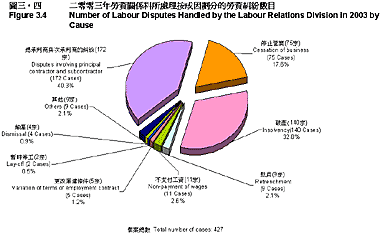
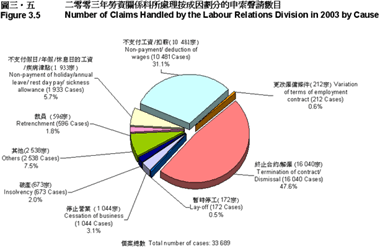
Skip to content

Labour Department Annual Report


FIGURES and CHARTS

Figure 3.2 Number of Labour Disputes Handled by the Labour Relations Division from 1999 to 2003
 
  * click to enlarge image
Figure 3.3 Number of Claims Handled by the Labour Relations Division from 1999 to 2003
 
  * click to enlarge image
Figure 3.4 Number of Labour Disputes Handled by the Labour Relations Division in 2003 by Cause
 
  * click to enlarge image
Figure 3.5 Number of Claims Handled by the Labour Relations Division in 2003 by Cause
 
  * click to enlarge image
Figure 3.6 Number of Strikes and Number of Employees Involved from 1999 to 2003
 
  * click to enlarge image
Figure 3.7 Number of Working Days Lost per 1 000 Salaried Employees and Wage-Earners from 1999 to 2003
 
  * click to enlarge image

top